Skip to content

Geospatial

Maps, earth observation, and all things geospatial.

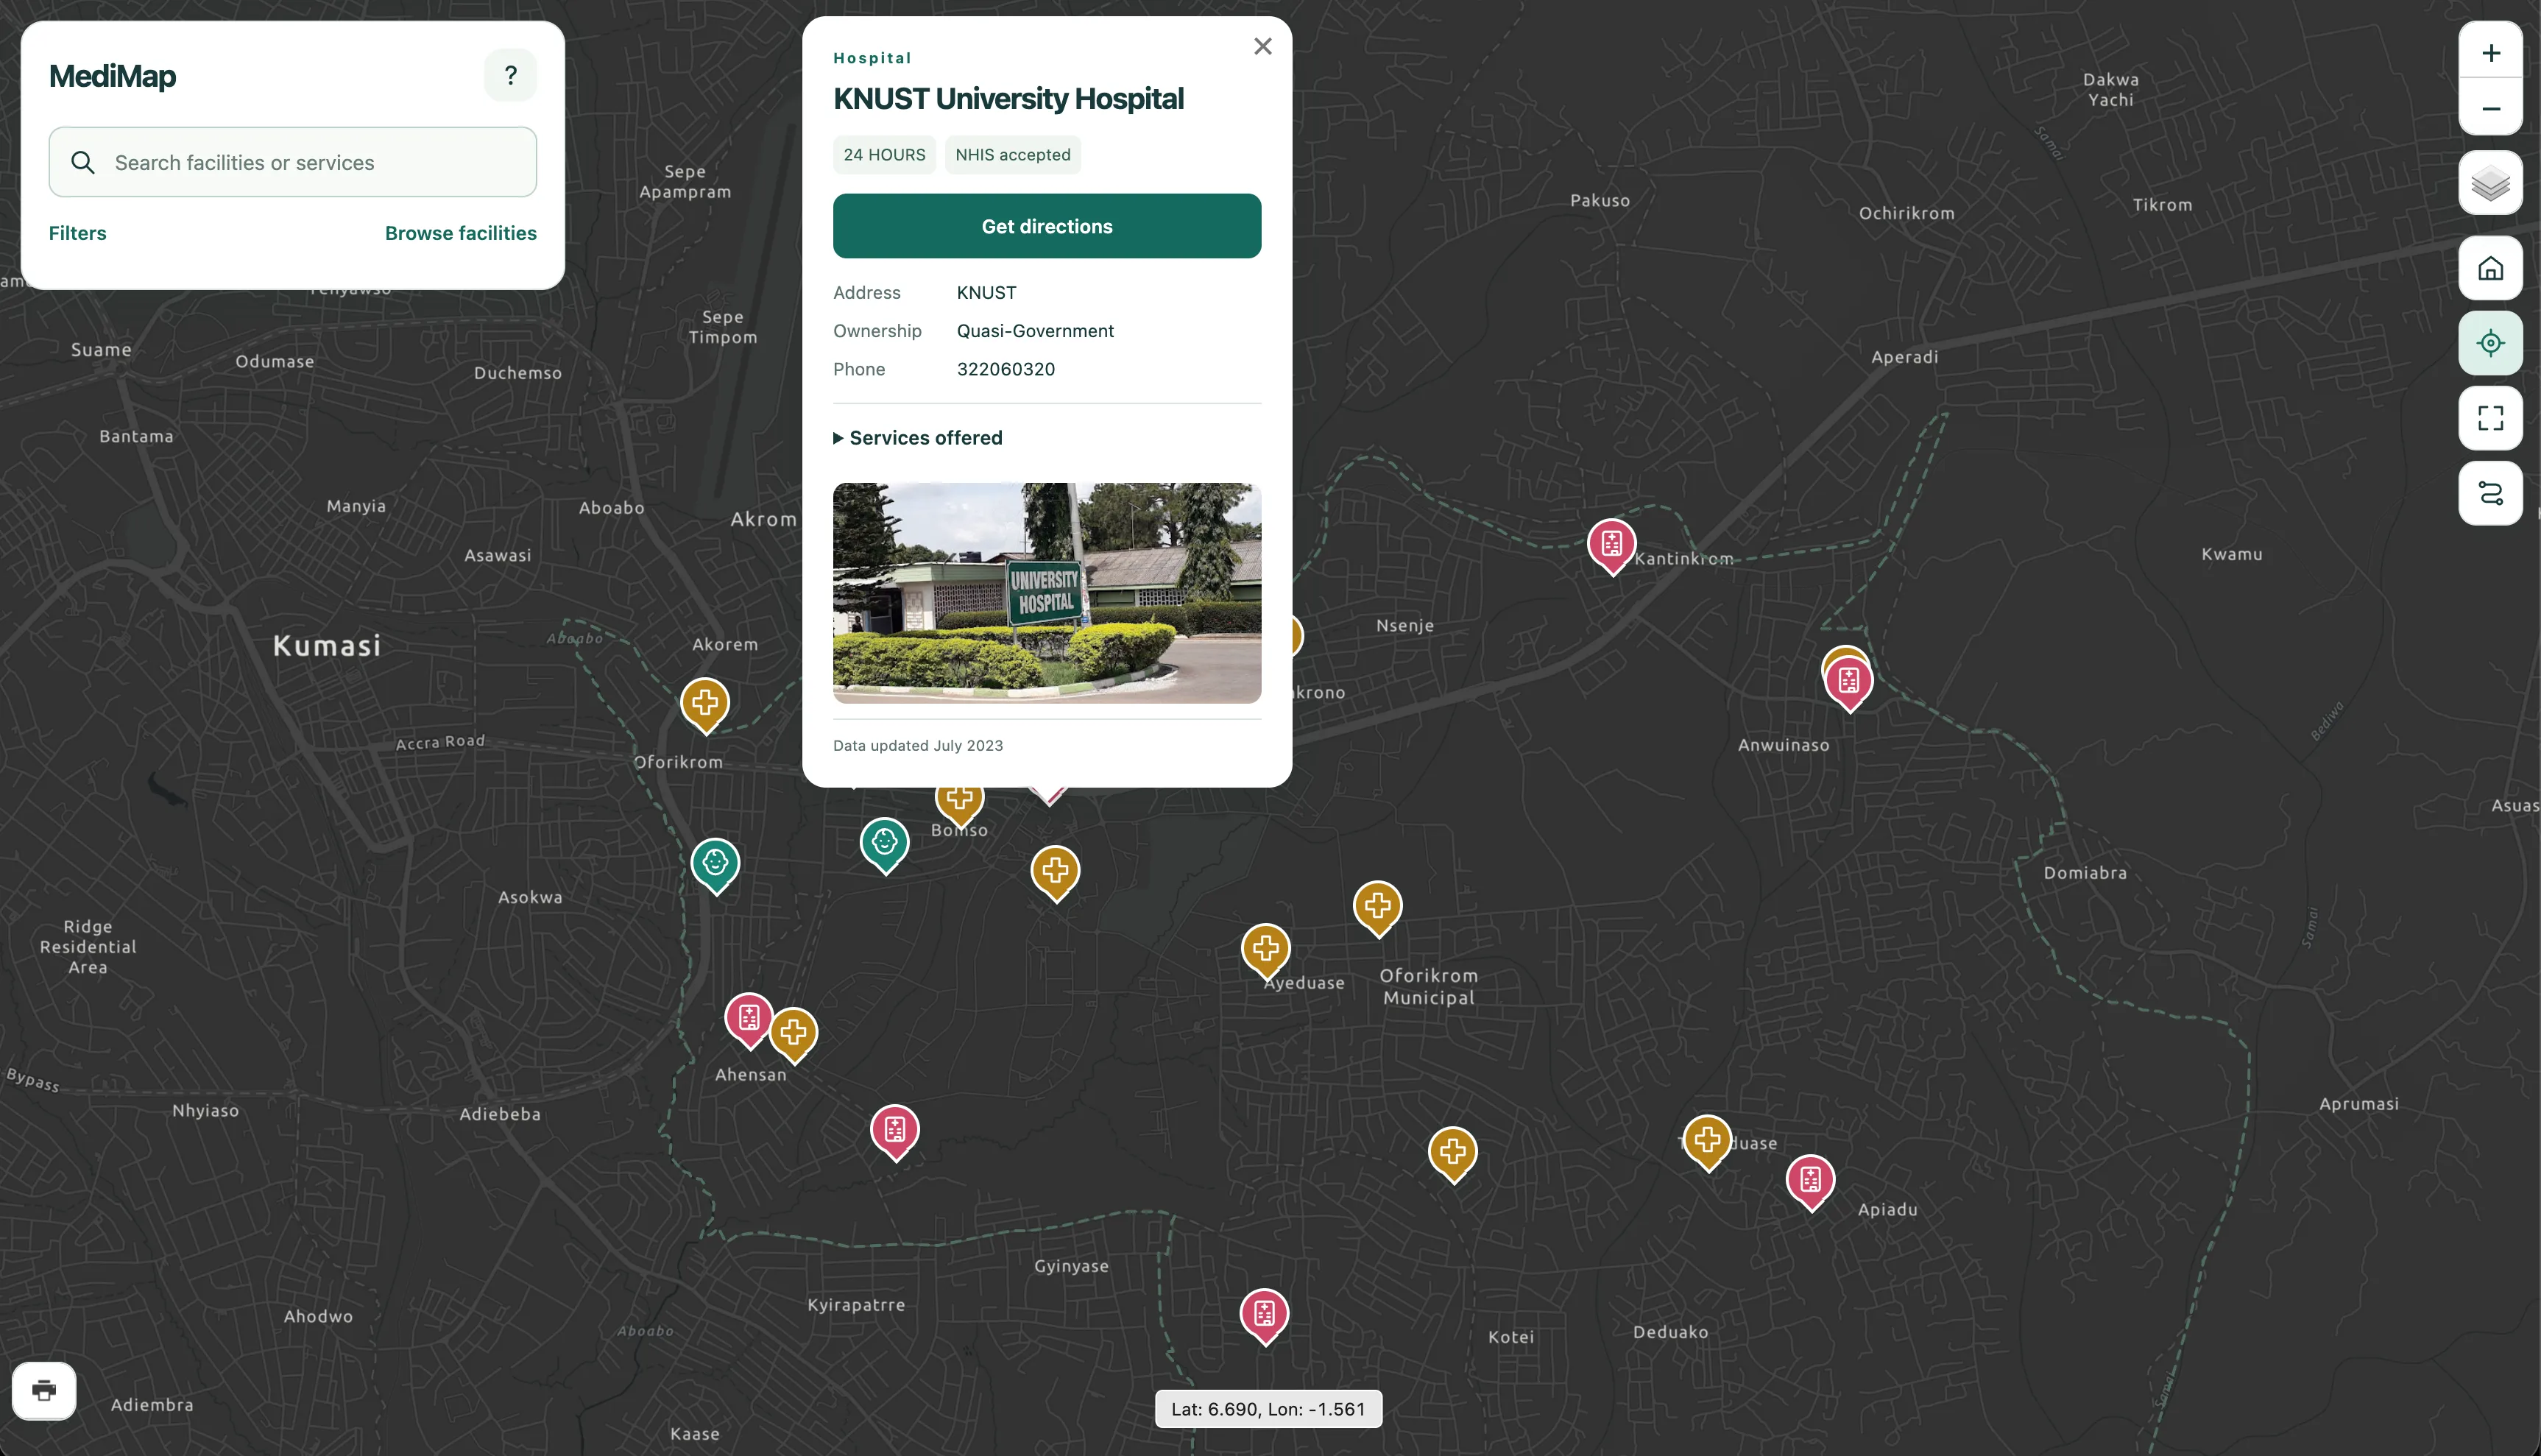
MediMap ↗

A webGIS application that helps users to discover healthcare facilities in Oforikrom, Ghana. Users can search for facilities, view detailed information, and get optimal routes and directions to a selected facility. Not every healthcare facility in the municipility appears on existing maps. Even when one does, critical information including services provided is often missing. MediMap enhances healthcare accessiblity through modern geospatial technologies.

  • Django
  • PostGIS
  • LeafletJS
  • TurfJS

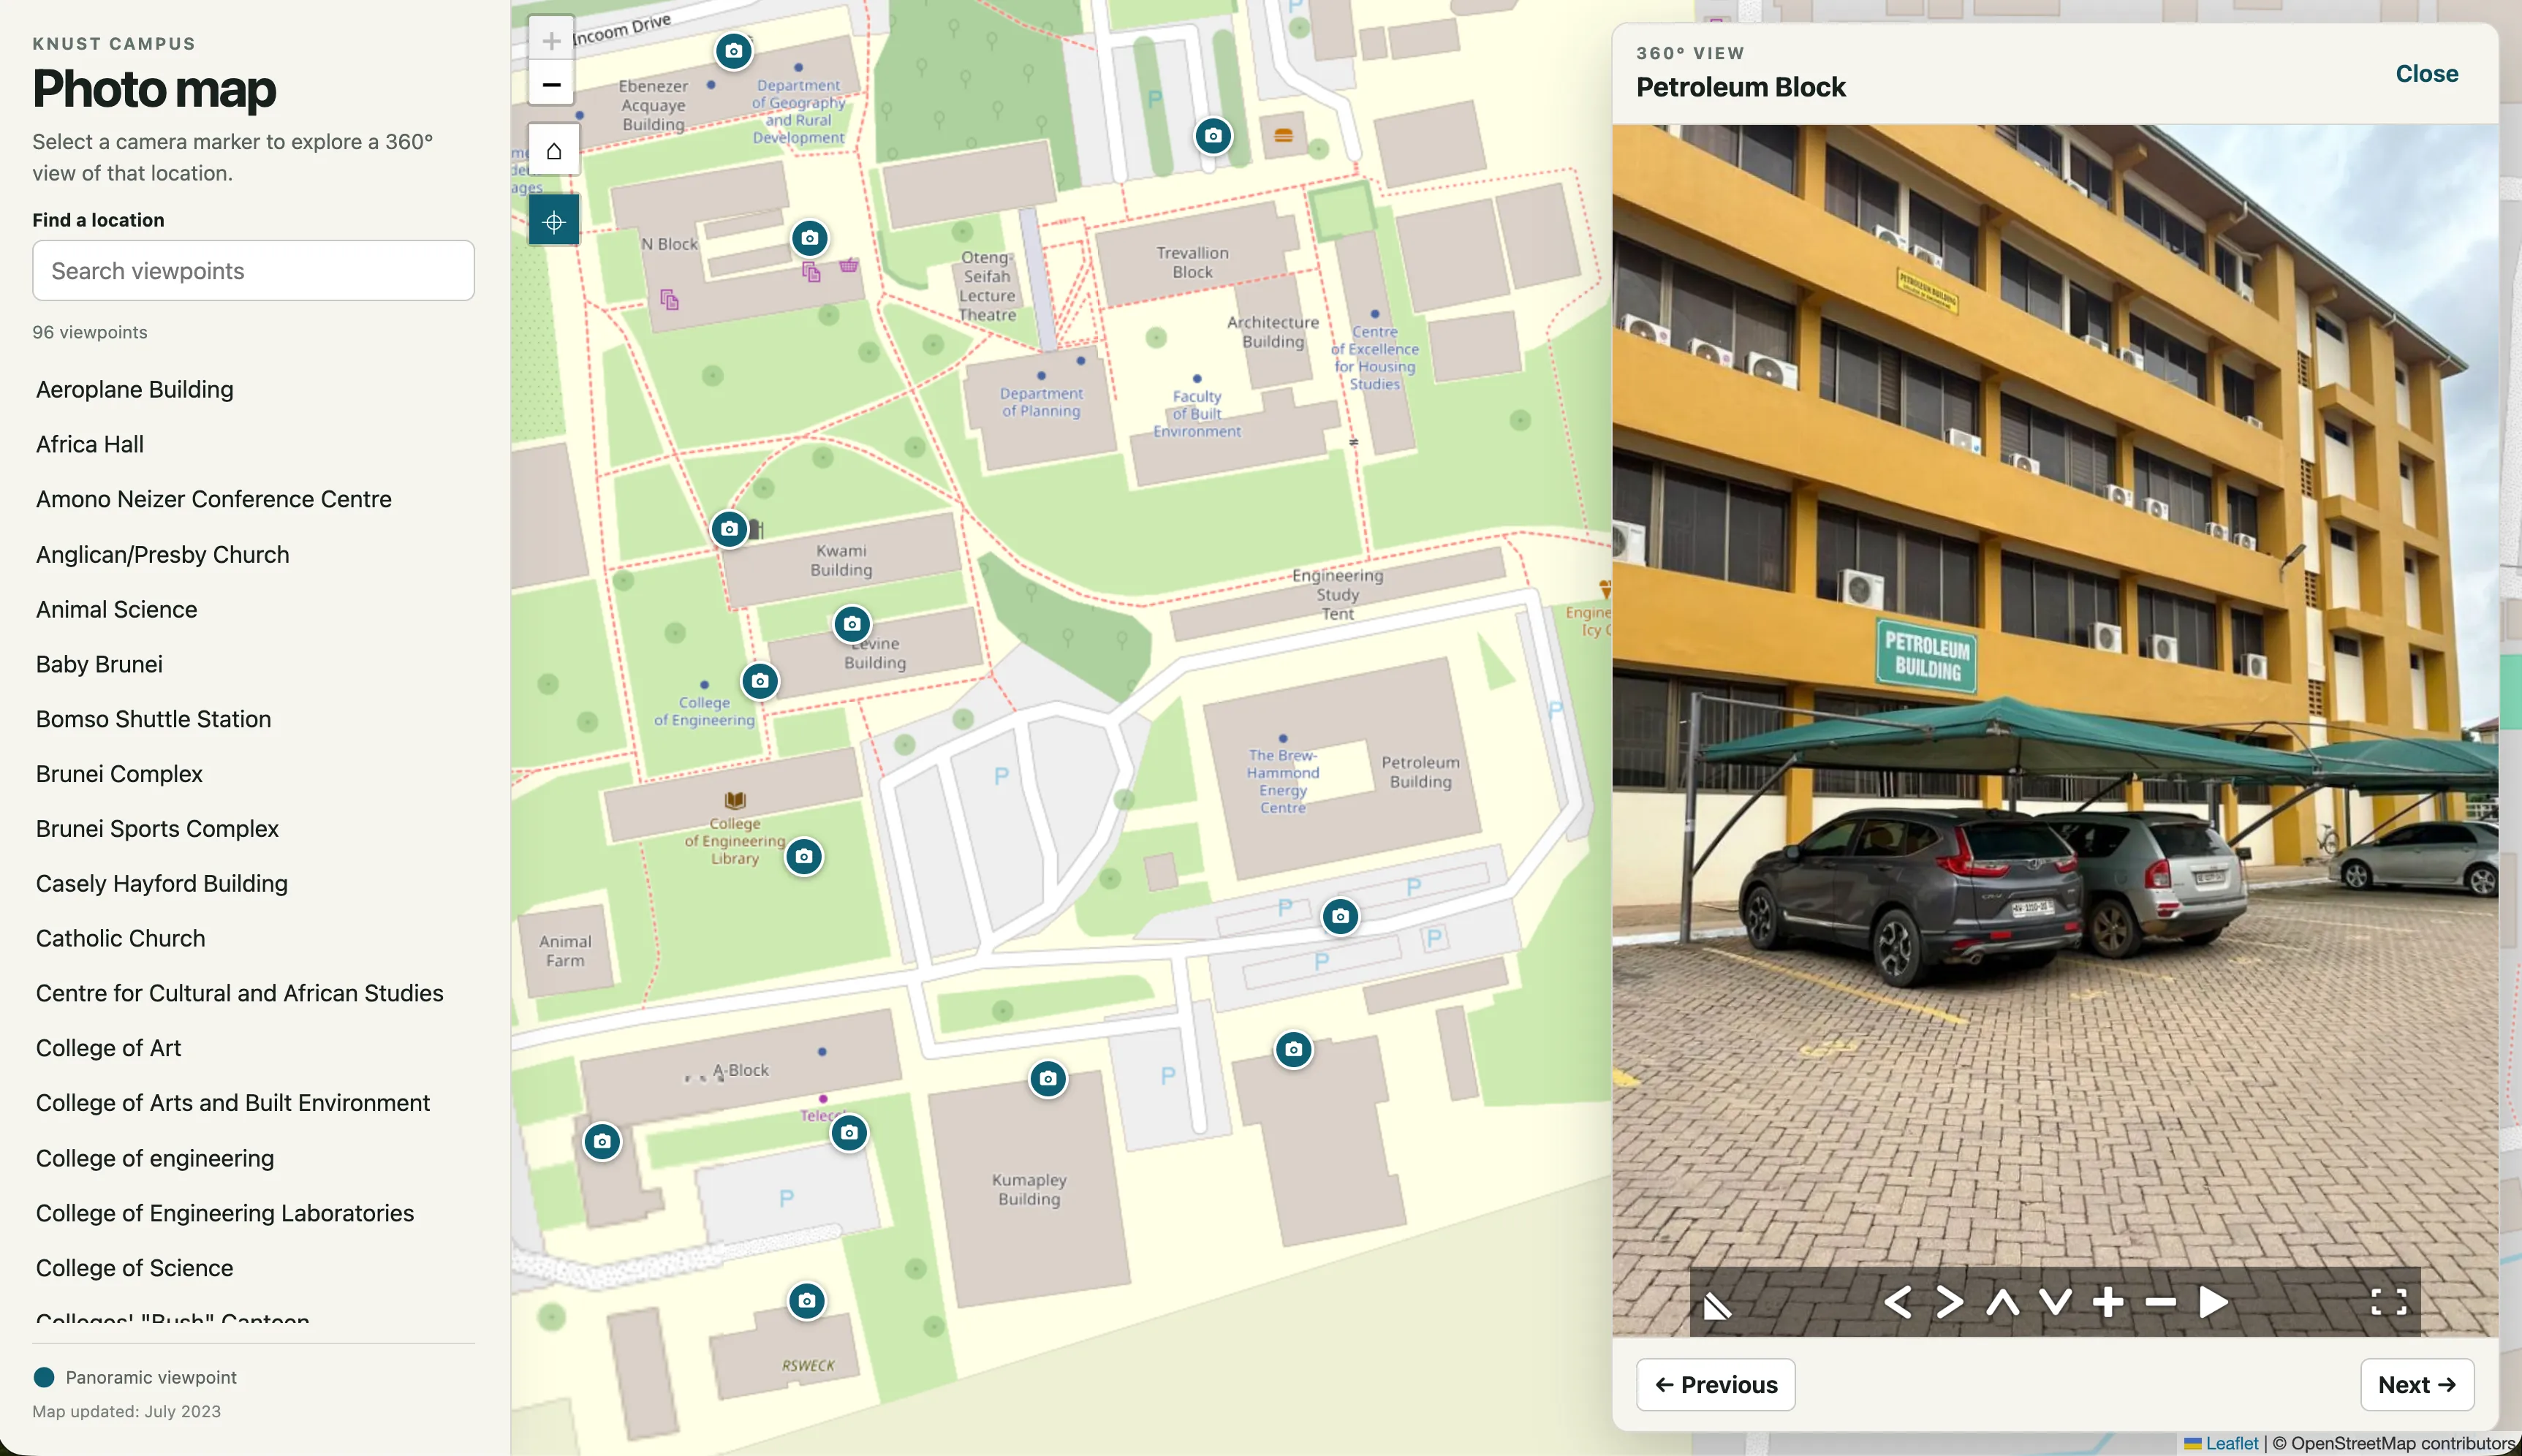
Panorama Photo Map ↗

An interactive web map that allows you to view panoramic photos of places on KNUST campus. Geographic coordinates and photos of the places were captured with a mobile phone and stitched together in Panorama Studio Viewer. Panorama Studio Viewer does all the panoramic photos work. The coordinates were used to create geoJSON feature points and rendered using Leaflet. This is a serverless web map with no database.

  • LeafletJS

Land-cover change

A planned satellite-image study of changing landscapes: where vegetation, built-up areas, and water give way to something new.

  • Landsat
  • Sentinel-2
  • Classification
Study outline
Approach
Compare cloud-masked images from comparable seasons, classify land cover, and examine transitions between classes.
Evaluation
Check class accuracy and change errors against independent reference samples, documenting dates, resolution, and cloud-related gaps.
Intended output
Before-and-after maps, a transition summary, and a reproducible analysis notebook.

Vegetation through time

A planned exploration of seasonal greenness and vegetation change using satellite time series and vegetation indices.

  • Sentinel-2
  • Landsat
  • NDVI
Study outline
Approach
Build NDVI time series and compare seasonal patterns and anomalies across selected landscapes.
Evaluation
Track missing observations and cloud masking, test the seasonal baseline, and compare with independent observations where available. Greenness is an indicator, not a direct measure of ecosystem health.
Intended output
Vegetation maps and a time-series view with documented preprocessing and uncertainty.

Mapping flood extent

A planned investigation of how radar and optical imagery can reveal flood extent when clouds obscure the view.

  • Sentinel-1
  • Radar
  • Terrain data
Study outline
Approach
Compare pre- and post-event radar imagery, separate potential inundation from permanent water, and refine the interpretation with terrain and optical observations.
Evaluation
Compare with independent event observations and examine false detections and missed flooding around buildings and vegetation.
Intended output
An event-based flood map with acquisition dates, validation evidence, and detection limitations.